Kibana vs. the Alternatives: Which Analytics and Visualization Platform is Right for You?
Kibana is a web-based analytics and visualization platform that allows users to explore, analyze, and visualize large datasets using various interactive tools. In this article, we will discuss the background of Kibana, its features, and how to get started with it.
Background
Kibana was first released in 2014 as part of the ELK stack (Elasticsearch, Logstash, and Kibana) and quickly gained popularity among developers, data analysts, and IT operations teams. The ELK stack was designed to provide a powerful, open-source solution for collecting, storing, and analyzing large amounts of data in real-time. Kibana was the front-end component of the stack, providing users with a visual interface for exploring and analyzing data stored in Elasticsearch.
Today, Kibana has evolved into a standalone platform that can be used with various data sources, including Elasticsearch, Apache Kafka, and SQL databases. Kibana supports a wide range of data visualization options, including charts, graphs, maps, and tables, and provides users with powerful query and filtering capabilities.
Kibana is useful in a variety of use cases. For example, a business can use Kibana to analyze customer data and gain insights into customer behavior and preferences. IT operations teams can use Kibana to monitor system logs and detect issues before they become critical. Developers can use Kibana to analyze application logs and troubleshoot issues.
In addition, Kibana can be used for security analytics, machine learning, and IoT data analytics. With Kibana, users can create custom dashboards, alerts, and reports to monitor and analyze data in real-time.
Getting Started with Kibana
To get started with Kibana, you will need to install Elasticsearch and Kibana on your machine or server. Once installed, you can configure Kibana to connect to your data source and start exploring your data.
Here are the basic steps to get started with Kibana:
- Install Elasticsearch and Kibana on your machine or server.
- Configure Elasticsearch to index your data source.
- Configure Kibana to connect to Elasticsearch.
- Use Kibana to explore and analyze your data.
Here is an example of how to install Kibana on Ubuntu using the command line:
sudo apt-get update && sudo apt-get install kibana
Once Kibana is installed, you can start the Kibana service using the following command:
sudo systemctl start kibana
You can access the Kibana web interface by opening a web browser and navigating to http://localhost:5601. From there, you can configure Kibana to connect to your data source and start exploring your data.
Here is an example of how to configure Kibana to connect to Elasticsearch:
elasticsearch.hosts: ["http://localhost:9200"]
This configuration tells Kibana to connect to Elasticsearch running on the same machine using the default port.
How can I use Kibana?
Once you have configured Kibana to connect to your data source, you can start exploring and analyzing your data using various Kibana features. Here are some examples:
Discover
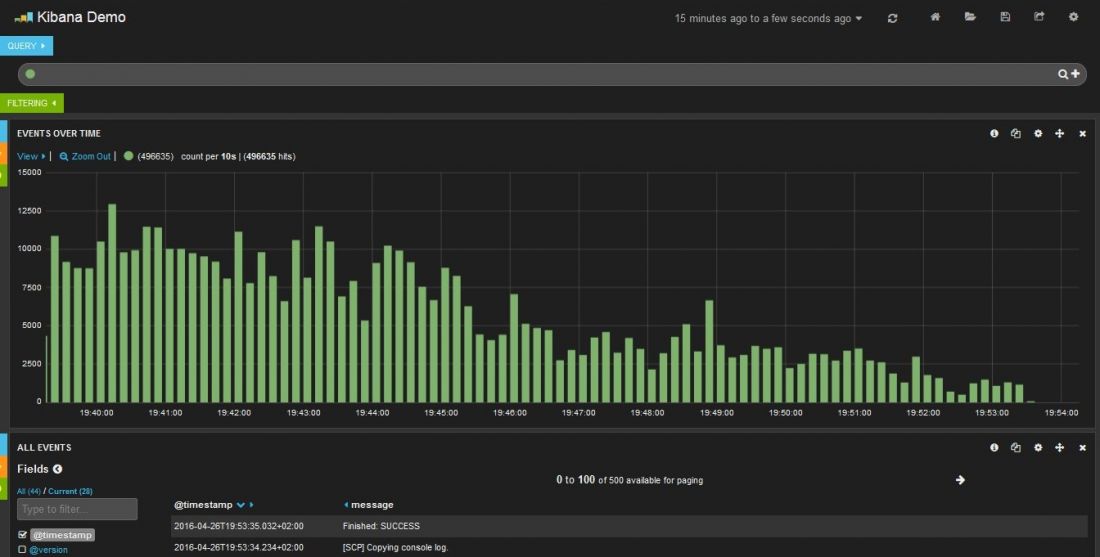
The Discover feature in Kibana allows you to explore your data and visualize it using various charts and tables. You can use Discover to search and filter your data, create custom visualizations, and save your searches and visualizations for later use. To access Discover, click on the "Discover" tab in the Kibana navigation menu.
Visualize
The Visualize feature in Kibana allows you to create custom visualizations using your data. You can choose from various chart types, including line charts, bar charts, pie charts, and more. You can also use the Visualize feature to create dashboards, which allow you to combine multiple visualizations into a single view. To access Visualize, click on the "Visualize" tab in the Kibana navigation menu.
Dashboard
The Dashboard feature in Kibana allows you to create custom dashboards using your data and visualizations. You can use the Dashboard feature to monitor your data in real-time, create alerts, and share your dashboards with other users. To access Dashboard, click on the "Dashboard" tab in the Kibana navigation menu.
Alerts
The Alerts feature in Kibana allows you to create custom alerts based on your data. You can use Alerts to monitor your data in real-time and receive notifications when certain conditions are met. To access Alerts, click on the "Alerts" tab in the Kibana navigation menu.
Machine Learning
The Machine Learning feature in Kibana allows you to apply machine learning algorithms to your data to detect anomalies, forecast trends, and more. You can use Machine Learning to create custom machine learning jobs, visualize the results, and automate actions based on the results. To access Machine Learning, click on the "Machine Learning" tab in the Kibana navigation menu.
What data (logs) can Kibana analyze?
Web server logs
Kibana can be used to analyze access logs from web servers to gain insights into website traffic, user behavior, and performance. You can use Kibana to create visualizations and dashboards that show which pages are being accessed the most, which visitors are coming from which locations, and which browsers and devices are being used.
Application logs
Kibana can be used to analyze logs from applications to troubleshoot issues, monitor performance, and improve application behavior. You can use Kibana to create visualizations and dashboards that show which errors are occurring the most, which users are experiencing issues, and which parts of the application are slowest.
Network logs
Kibana can be used to analyze logs from network devices, such as routers and switches, to monitor traffic, detect issues, and troubleshoot connectivity problems. You can use Kibana to create visualizations and dashboards that show which devices are generating the most traffic, which protocols are being used the most, and which devices are experiencing the most errors.
Security logs
Kibana can be used to analyze logs from security devices, such as firewalls and intrusion detection systems, to monitor for security threats and respond to incidents. You can use Kibana to create visualizations and dashboards that show which users are attempting to access restricted resources, which IP addresses are generating the most traffic, and which security alerts are being triggered the most.
Kibana is flexible and can be used to analyze logs from a wide range of sources, including operating systems, databases, and cloud services.
What are the alternatives to Kibana?
There are several alternatives to Kibana, depending on your specific use case and requirements. Here are some popular alternatives:
Grafana
Grafana is a popular open-source analytics and visualization platform that allows users to create custom dashboards and alerts using a wide range of data sources, including Elasticsearch, Prometheus, and more. Grafana provides a wide range of visualizations and plugins, making it a popular choice for monitoring and observability.
https://grafana.com/
Tableau
Tableau is a popular commercial analytics and visualization platform that allows users to create custom dashboards and reports using a wide range of data sources. Tableau provides a user-friendly interface and powerful analytics capabilities, making it a popular choice for business intelligence and data analysis.
https://www.tableau.com/
Power BI
Power BI is a popular commercial analytics and visualization platform developed by Microsoft. It allows users to create custom dashboards and reports using a wide range of data sources, including Microsoft Excel, SQL Server, and more. Power BI provides powerful data modeling and visualization capabilities, making it a popular choice for business intelligence and data analysis.
https://powerbi.microsoft.com/
Splunk
Splunk is a popular commercial platform for collecting, analyzing, and visualizing machine-generated data, including logs, metrics, and more. Splunk provides a wide range of tools and features for working with machine data, making it a popular choice for IT operations and security analytics.
https://www.splunk.com/
Graylog
Graylog is an open-source platform for collecting, processing, and analyzing log data. It provides a user-friendly interface and powerful search and visualization capabilities, making it a popular choice for log management and analysis.
https://www.graylog.org/
Kibana pricing
Kibana is an open-source software project developed by Elastic, which means that the software itself is free to use and distribute. However, Elastic offers a range of paid products and services that complement Kibana and provide additional functionality and support.
One of the most important paid products is the Elasticsearch Service, which is a managed Elasticsearch and Kibana solution offered by Elastic. With the Elasticsearch Service, you can run Elasticsearch and Kibana in the cloud and take advantage of Elastic's expertise and support.
The Elasticsearch Service is priced based on usage, with different pricing tiers available depending on the size of your deployment and the level of support you require. The pricing includes a range of features, including automatic scaling, security, backups, and more.
In addition to the Elasticsearch Service, Elastic offers a range of other paid products and services that work with Kibana, including machine learning, security, and monitoring. The pricing for these products and services varies based on the features and level of support required.
Overall, Kibana is a flexible and powerful analytics and visualization platform that can be used for a wide range of use cases. While some paid products and services are available from Elastic, the open-source software itself is free to use and distribute.
More info on Kibana
- Kibana official site: https://www.elastic.co/kibana/
- Kibana documentation: https://www.elastic.co/guide/en/kibana/current/index.html
- Kibana tutorials: https://www.elastic.co/guide/en/kibana/current/tutorial-load-dataset.html
The Kibana documentation includes a wide range of topics, including getting started, data visualization, reporting, security, and more. The Kibana tutorials provide step-by-step instructions for common tasks, such as loading a dataset, creating a visualization, and building a dashboard.
Additionally, the Elastic website provides a wealth of resources for learning about the ELK stack, including webinars, blog posts, and community forums.
Conclusion
Kibana is a powerful open-source analytics and visualization platform that allows users to explore and analyze large datasets using various interactive tools. Kibana is part of the ELK stack, which also includes Elasticsearch and Logstash, and is designed to work with Elasticsearch to provide a complete data management and analysis solution.
Kibana provides a range of features and tools for exploring and visualizing data, including Discover, Visualize, Dashboard, Alerts, and Machine Learning. With Kibana, users can create custom dashboards, alerts, and reports to monitor and analyze data in real-time.
While Kibana itself is free to use and distribute, Elastic offers a range of paid products and services that complement Kibana and provide additional functionality and support, including the Elasticsearch Service, machine learning, security, and monitoring.
Overall, Kibana is a powerful and flexible analytics and visualization platform that can be used for a wide range of use cases. Whether you are a developer, data analyst, or IT operations professional, Kibana provides a user-friendly and intuitive interface for exploring and analyzing large datasets.